
Statistical Widgets
Statistical widgets are the backbone of any effective dashboard, transforming raw data into meaningful visual insights that drive business decisions. Filament's stats overview widgets provide a powerful yet intuitive way to display key metrics, from simple KPI cards to complex trend analyses with embedded charts. These widgets automatically handle responsive layouts, real-time updates, and seamless integration with your existing data sources, making it effortless to create compelling dashboards that work beautifully across all devices.
# Single Stat Cards
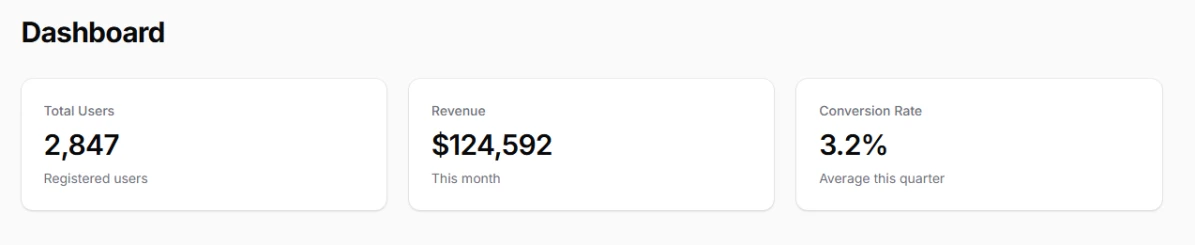
Display individual metrics as clean, focused cards with large prominent values and optional contextual information. Perfect for highlighting your most important KPIs at a glance. These cards automatically format numbers and provide consistent visual hierarchy across your dashboard.
You can create a widget scaffold with a filament command:
php artisan make:filament-widget
And then customize it further:
use Filament\Widgets\StatsOverviewWidget;
use Filament\Widgets\StatsOverviewWidget\Stat;

class SimpleStatsWidget extends StatsOverviewWidget
{
    protected function getStats(): array
    {
        return [
            Stat::make('Total Users', '2,847')
                ->description('Registered users'),
            Stat::make('Revenue', '$124,592')
                ->description('This month'),
            Stat::make('Conversion Rate', '3.2%')
                ->description('Average this quarter'),
        ];
    }
}
# Stat Overview Grids
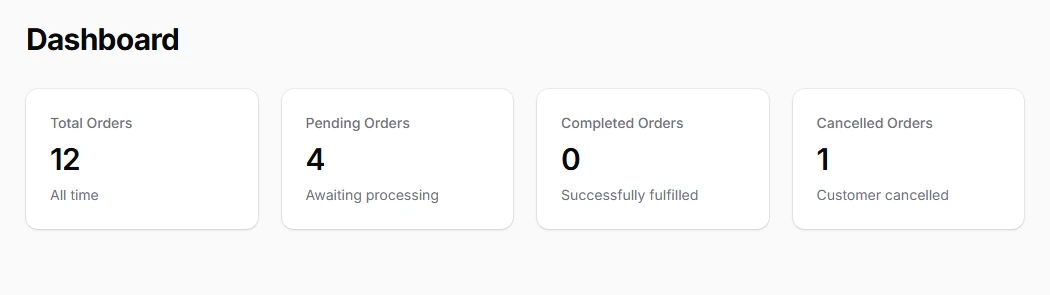
Organize multiple related statistics in responsive grid layouts that automatically adapt to different screen sizes. Use responsive column spans to control how many stats appear per row on different devices, ensuring optimal readability across all breakpoints.
use App\Models\Order;
use Filament\Widgets\StatsOverviewWidget;
use Filament\Widgets\StatsOverviewWidget\Stat;

class SimpleStatsWidget extends StatsOverviewWidget
{
    protected function getColumns(): int
    {
        return 4; // 4 stats per row on larger screens
    }

    protected function getStats(): array
    {
        return [
            Stat::make('Total Orders', Order::count())
                ->description('All time'),
            Stat::make('Pending Orders', Order::where('status', 'pending')->count())
                ->description('Awaiting processing'),
            Stat::make('Completed Orders', Order::where('status', 'completed')->count())
                ->description('Successfully fulfilled'),
            Stat::make('Cancelled Orders', Order::where('status', 'cancelled')->count())
                ->description('Customer cancelled'),
        ];
    }
}
# Trend Indicators
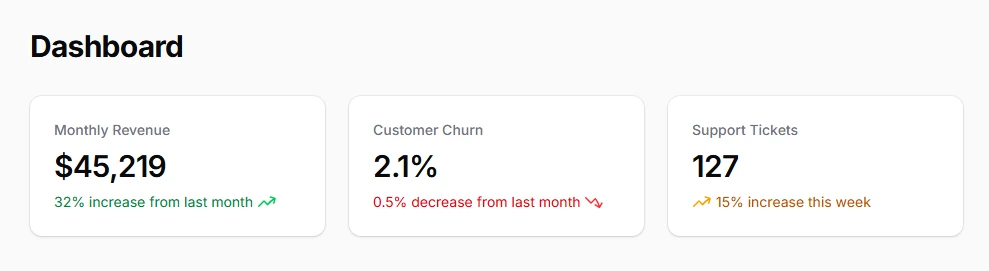
Add visual direction indicators with icons and descriptions to show whether metrics are trending up, down, or staying stable. Color-coded descriptions provide immediate context about performance changes without requiring additional explanation.
use Filament\Widgets\StatsOverviewWidget\Stat;
use Filament\Support\Enums\IconPosition;

protected function getStats(): array
{
    return [
        Stat::make('Monthly Revenue', '$45,219')
            ->description('32% increase from last month')
            ->descriptionIcon('heroicon-m-arrow-trending-up')
            ->color('success'),
        Stat::make('Customer Churn', '2.1%')
            ->description('0.5% decrease from last month')
            ->descriptionIcon('heroicon-m-arrow-trending-down')
            ->color('danger'),
        Stat::make('Support Tickets', '127')
            ->description('15% increase this week')
            ->descriptionIcon('heroicon-m-arrow-trending-up', IconPosition::Before)
            ->color('warning'),
    ];
}
# Mini Charts Integration
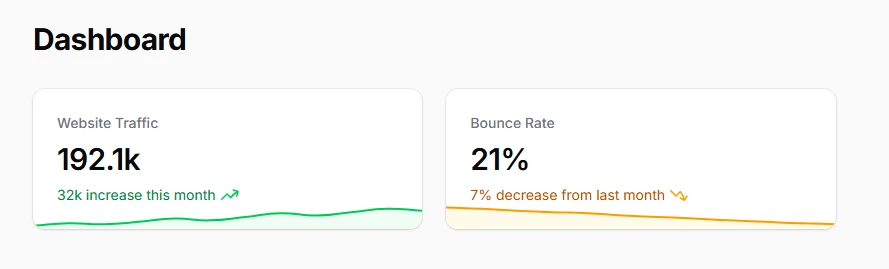
Embed historical trend data directly within stat cards using mini charts. These sparkline-style visualizations provide immediate context about data patterns while maintaining the clean aesthetic of statistical displays.
use Filament\Widgets\StatsOverviewWidget\Stat;

protected function getStats(): array
{
    return [
        Stat::make('Website Traffic', '192.1k')
            ->description('32k increase this month')
            ->descriptionIcon('heroicon-m-arrow-trending-up')
            ->chart([7, 12, 10, 15, 22, 18, 25, 33, 28, 35, 42, 38])
            ->color('success'),
        Stat::make('Bounce Rate', '21%')
            ->description('7% decrease from last month')
            ->descriptionIcon('heroicon-m-arrow-trending-down')
            ->chart([45, 42, 38, 35, 33, 28, 25, 22, 18, 15, 12, 10])
            ->color('primary'),
    ];
}
# Number Formatting
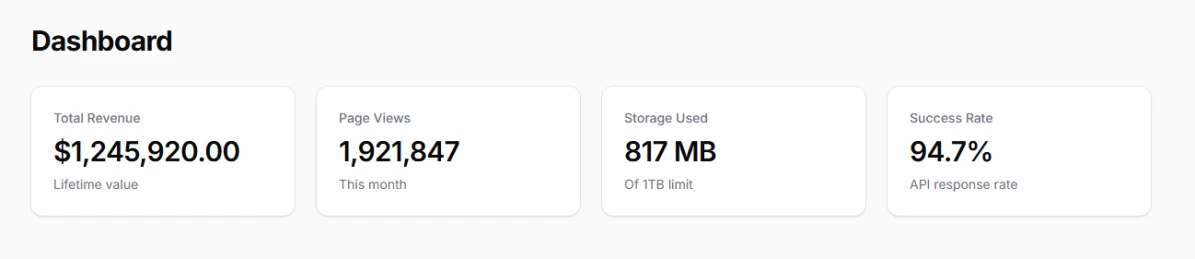
Automatically format large numbers, currencies, and percentages using Laravel's Number helper or custom formatting functions. Ensure consistent presentation across all statistical displays while maintaining readability.
use Illuminate\Support\Number;
use Filament\Widgets\StatsOverviewWidget\Stat;

protected function getStats(): array
{
    return [
        Stat::make('Total Revenue', Number::currency(1245920, 'USD'))
            ->description('Lifetime value'),
        Stat::make('Page Views', Number::format(1921847))
            ->description('This month'),
        Stat::make('Storage Used', Number::fileSize(856234567))
            ->description('Of 1TB limit'),
        Stat::make('Success Rate', Number::percentage(94.7, 1))
            ->description('API response rate'),
    ];
}
# Resource Table Integration
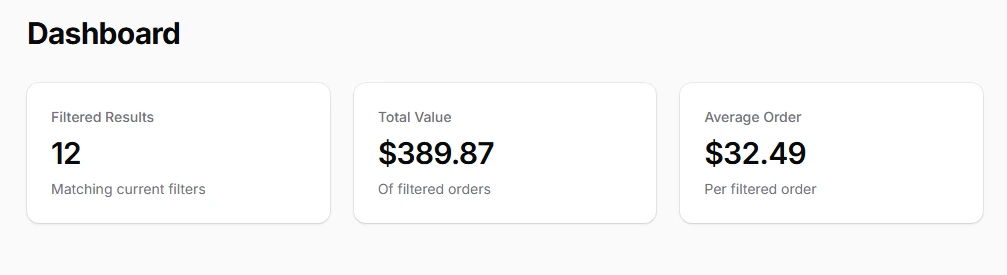
Display statistics that automatically reflect table filters and search by integrating with resource tables. Use the InteractsWithPageTable trait to sync your stats with the current table query state.
use Filament\Widgets\StatsOverviewWidget as BaseWidget;
use Filament\Widgets\Concerns\InteractsWithPageTable;
use App\Filament\Resources\OrderResource\Pages\ListOrders;

class TableStatsWidget extends BaseWidget
{
    use InteractsWithPageTable;

    protected function getTablePage(): string
    {
        return ListOrders::class;
    }

    protected function getStats(): array
    {
        return [
            Stat::make('Filtered Results',
                $this->getPageTableQuery()->count()
            )->description('Matching current filters'),

            Stat::make('Total Value',
                '$' . number_format(
                    $this->getPageTableQuery()->sum('total') / 100, 2
                )
            )->description('Of filtered orders'),

            Stat::make('Average Order',
                '$' . number_format(
                    $this->getPageTableQuery()->avg('total') / 100, 2
                )
            )->description('Per filtered order'),
        ];
    }
}
# Auto-Refresh and Polling

Keep your statistics current with real-time updates by configuring automatic refresh intervals. Essential for live dashboards monitoring real-time metrics like concurrent users, active sessions, or streaming data.
use Filament\Widgets\StatsOverviewWidget as BaseWidget;

class LiveStatsWidget extends BaseWidget
{
    protected ?string $pollingInterval = '5s'; // Refresh every 5 seconds

    protected function getStats(): array
    {
        return [
            Stat::make('Active Sessions',
                \DB::table('sessions')
                    ->where('last_activity', '>', now()->subMinutes(5))
                    ->count()
            )->description('Online now'),

            Stat::make('Cache Hit Rate',
                Number::percentage(
                    \Cache::get('hit_rate_percentage', 0), 1
                )
            )->description('Last minute average'),
        ];
    }
}