
Widgets
Enhance your dashboards and pages with interactive, data-driven widgets that communicate insights at a glance. From stat cards and charts to resource tables and filtered visualizations, this section shows how to build, customize, and update widgets that display meaningful data and drive informed decisions.
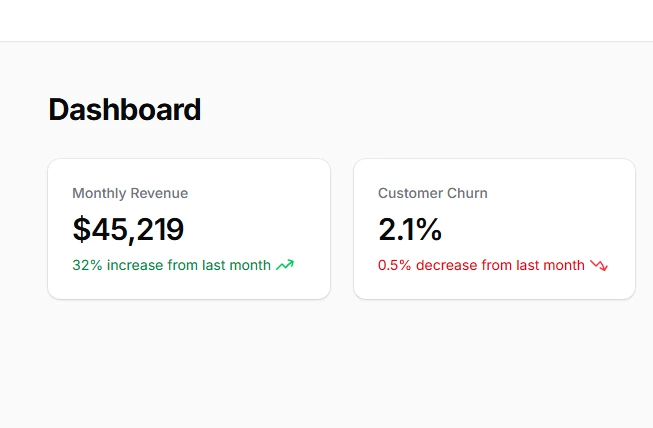
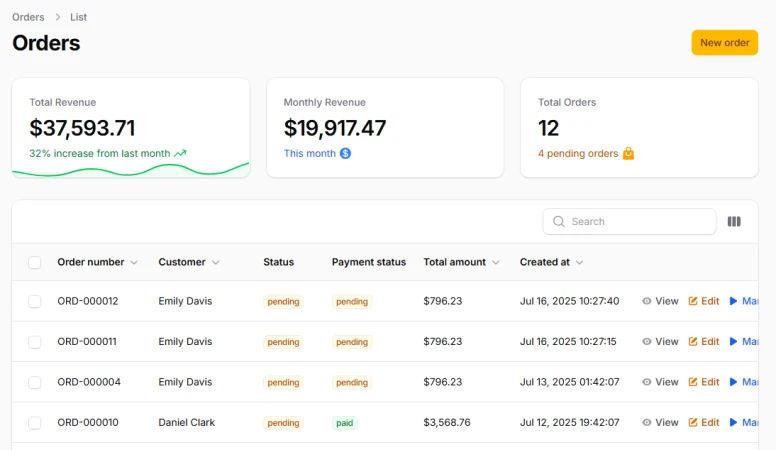
Statistical Widgets
Statistical widgets are the backbone of any effective dashboard, transforming raw data into meaningful visual insights that drive business decisions. Filament's stats overview widgets provide a powerful yet intuitive way to display key metrics...
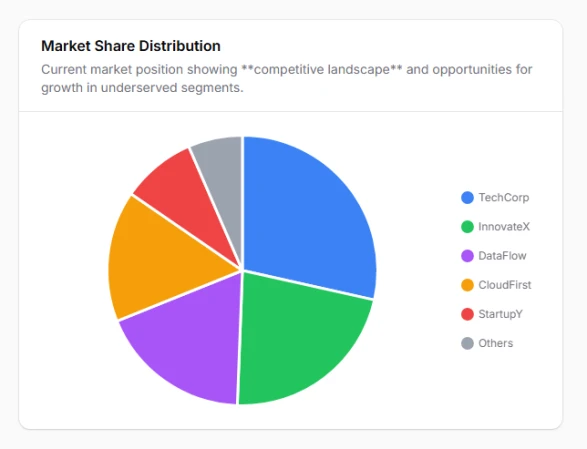
Chart Widgets
Transform raw data into compelling visual stories with Filament's powerful chart widget system. Built on the proven Chart.js foundation, these widgets provide everything from simple line graphs to complex multi-dataset visualizations...
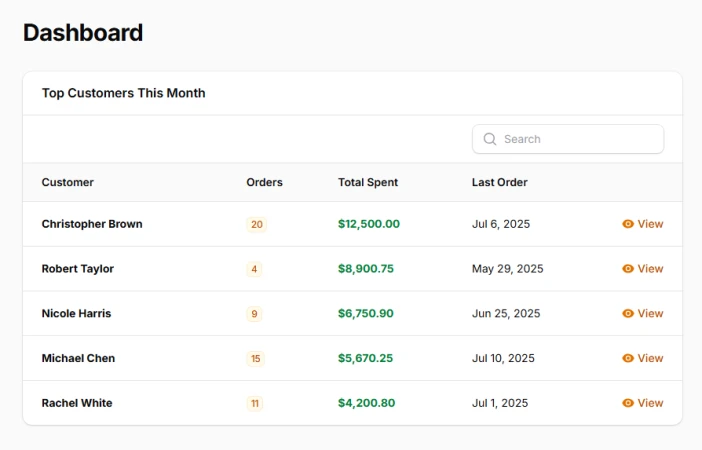
Data Widgets
Transform raw information into engaging visual narratives that tell the story of your application's data. Filament's data widgets go beyond simple statistics to create interactive dashboards that highlight trends, showcase activity, and present actionable insights.
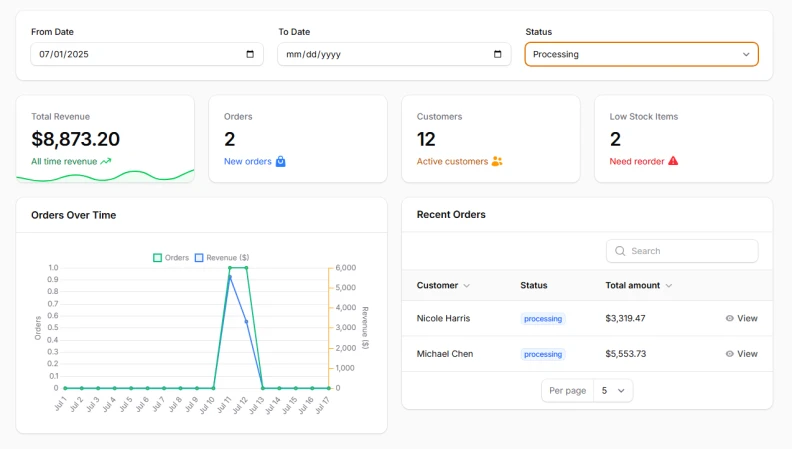
Widget Filters
Transform your dashboard into a dynamic data exploration tool with powerful filtering capabilities that work seamlessly across all your widgets. Whether you need simple date ranges, complex multi-field forms, or real-time filtering updates...
Widget Location
Transform your Filament applications from static admin panels into dynamic, data-driven dashboards by strategically placing widgets exactly where users need them most...